January 22, 2025 By Mary Power
The Salvator Dali Museum houses a painting titled “Lincoln in Dalivision”. Up close, it appears to depict a woman looking out at the sea, with a small picture of Abraham Lincoln in the bottom left-hand corner. But when you step back, the entire painting is transformed into a portrait of Lincoln. I’m reminded of that image now that it’s budget season. Understandably, there is a lot of discussion about specific line items and programs. But it’s also important to take a step back and see the whole picture, particularly the education budget given its size and complexity. Here’s what I see when I take a step back.
The proposed $70.4 million education budget represents a 30% (or $16.2 million) increase since fiscal year 2020 (when COVID hit). That’s an average increase of 5% per year – twice as high as the limits imposed by Proposition 2 1⁄2.
Major spending increases include Teaching and Instruction ($10.6 million), Central Office and Building Administration ($1.2 million), Special Education Counseling and Psychological Services ($1.0 million), In-District Transportation ($0.7 million), Utilities and Heating ($0.7 million), and Special Education Supervision ($0.6 million).
Interestingly, proposed out-of-district tuitions and transportation expenses ($2.9 million) are actually $0.6 million less than actual fiscal year 2020 expenses ($3.5 million). One reason is the Memorandum of Understanding that accompanied the recent override. It caps the increase in out-of-district tuitions and specialized services funded by the school budget at 2%, with the Town picking up any excess. The proposed budget identifies $1.2 million in tuitions to be paid by the Town for the upcoming year.
Since COVID, student enrollment has declined by 15%. Enrollment grew steadily from 2000- 2015, then leveled off. In the year immediately following COVID, enrollment decreased by 368 students. It has since decreased by an additional 276 students (an average of 70 students per year) – for a total decrease of 646 students.
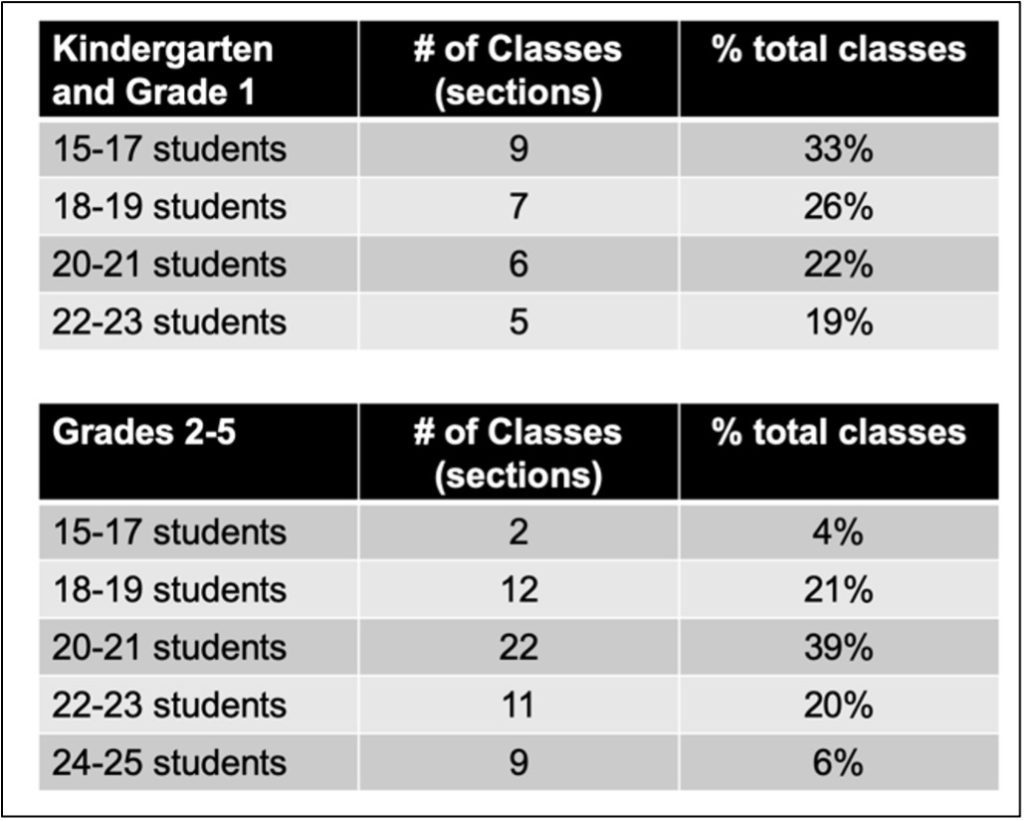
Class sizes are currently well below the maximum class size limits as defined in Hingham Public Schools’ own policies. Hingham Public School class size policies state that Kindergarten and Grade 1 class sizes should not exceed 23 students and Grades 2-5 class sizes should not exceed 25 students. The chart below shows the current number of classes (also referred to as sections) for various class sizes. Of note, 59% of Grade K-1 classes, and 25% of Grades 2-5 classes, have fewer than 20 students.

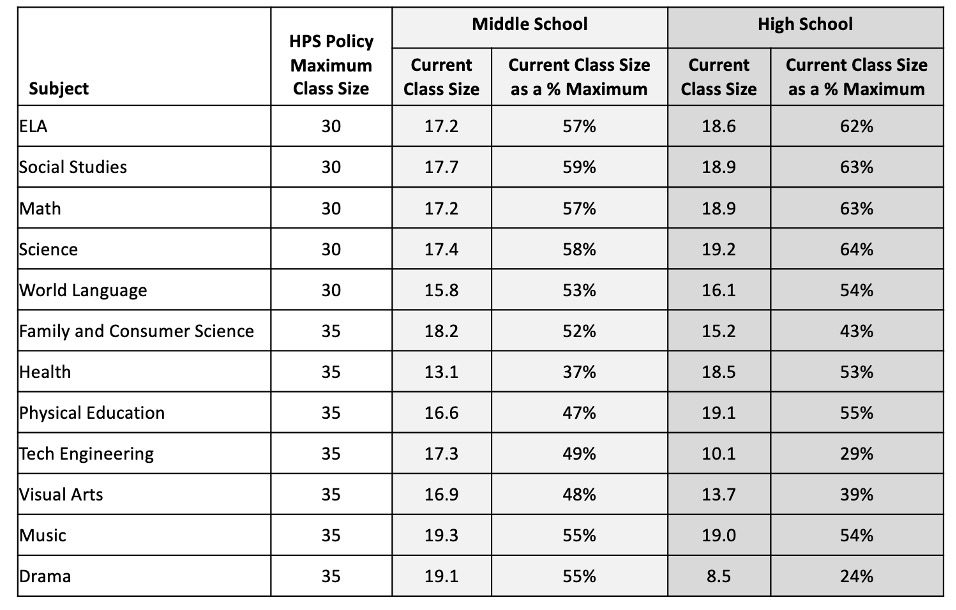
At the secondary level, the class size policy sets maximum class size for core classes at 30 students and a maximum of 35 students for electives and physical education. The chart below shows current class sizes for Hingham Middle School and High School subjects and how they compare to the class size policy (%). Across the board, all current class sizes are less than 2/3 of the maximum class size defined by the policy.

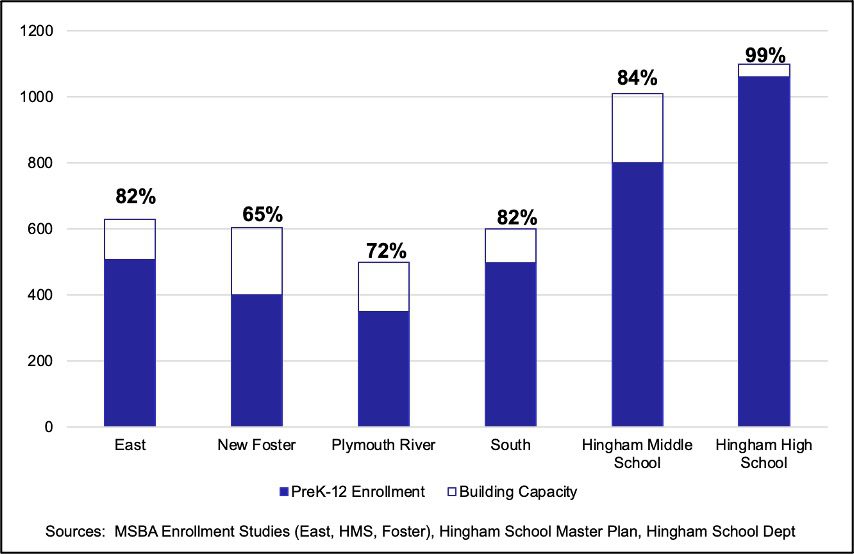
School buildings, particularly at the elementary level, are underutilized. With the opening of the new Foster School, Hingham Public School capacity is about 4,500 students. Current enrollment is 3,616 students. The chart below shows building capacity (the entire bar), current enrollment (the blue portion of each bar), and the % utilization for each of Hingham’s six schools.
Combined, Hingham’s four elementary schools can accommodate 2,335 students. Current PreK-5 enrollment is 1,756 students (75% of capacity).

The School Committee recently approved plans to propose warrant articles for the full replacement of three school roofs (Hingham High School, Plymouth River School, South School). The high school roof alone is estimated to cost nearly $15 million. Capital projects of this size are unlikely to be absorbed in the operating budget. As a result, funding these projects may require one or more debt exclusions (i.e. tax increases).
Observations
In my 2021 Select Board Report to Town Meeting, I stated that the growth rate of the education budget (average yearly growth of 5.9% over the last 15 years) was not sustainable and that overrides are only successful as a budgetary “reset” if future revenue and expense growth rates are aligned with each other. I still believe that today.
The MOU reflects those principles. It provides for 3.5% annual budget growth, which is what revenues (including the use of unassigned fund balance to put off another override until fiscal year 2028) can support. With the Town picking up the tab for out-of-district tuitions and specialized services that grow in excess of 2%, this effectively means the rest of the education budget can grow by about 4% per year.
When the override was proposed in spring of 2023, the School Department said: “If the proposed override is passed, the Hingham Public Schools will be able to maintain the current level of programming, retain current faculty and staff members, and continue progress toward the implementation of our strategic plan.” It concerns me that for the second year in a row, this isn’t happening despite continued decreases in enrollment. I don’t think it’s due to a lack of funding but is more a function of how the money is being spent.
Out of district tuitions and utility costs are not the big budget busters – it’s personnel costs which represent about 80% of the budget. It’s hard to tell how much of increase over the last six years is related to hiring additional staff vs. wage increases, but my sense is that it’s mostly the latter. Our school system is currently staffed and being operated to accommodate a much higher enrollment than we actually have. I question how much longer we can and should do that. To be clear, I’m not suggesting that every class size and building should be at the maximum. That’s neither desirable nor realistic. Rather, I question whether there are different alternatives to balancing the budget besides eliminating an entire worthwhile program such as elementary Spanish.
I also hope there will be discussion of a facility utilization plan during this year’s budget and warrant article hearings, particularly if taxpayers will be asked to fund capital projects requiring additional tax increases.
Mary Power has lived in Hingham for 25 years and has served the Town in many capacities including as a member of the Advisory Committee and the Hingham Select Board. She is the author of the “Inside Town Finances” series available on the Town of Hingham Website and Harbor Media.


I believe it’s essential to provide some historical context regarding the education budget. While the increase in the budget since 2020 may appear substantial, our school system has been playing catch-up long before the pandemic.
Discussions about growing expenses outpacing revenue date back to at least 2018, as seen in Town Meeting warrants. Our school district had staffing issues going back to the opening of East Elementary. The opening of East coincided with the Great Recession. At the time, a $2 million override was needed to fully staff the new school. The Town voted in 2009 to approve an override of $1.1 million. The Advisory Committee (AdCom) recommended that $960k of federal stimulus funds be used to close that budget gap. That federal stimulus money went away, leaving Hingham with a funding gap.
Gradually, Hingham Public Schools restored staffing, met state mandates, and updated curriculum, but it was a slow process. By the time the pandemic hit, the district was still running lean, which limited the district’s ability to space out students and address the challenges of COVID-19.
Recognizing the critical need for additional staff, the town used one-time federal and local “rainy day” funds to hire 32 positions. These staff additions allowed us to fully implement the Multi-Tiered System of Support (MTSS) model we had been discussing for years, as well as provide crucial academic and social-emotional support.
The 2023 override ensured that we could sustain these positions and avoid cutting 60 staff members, which was a real possibility if the override had not passed. The statement about being able to maintain the current level of programming was for the first year the override was passed.
Along with the override came a commitment to limit the growth rate of our budget to 3.5% annually over the next four years, formalized in a Memorandum of Understanding (MOU). The MOU states: “Some service reductions and/or increased fees may be necessary in FY25-27 to ensure the municipal and school departments manage to the budgeted growth rates outlined above.” The Town voting that year knew this was a very real possibility.
Managing a municipal budget is particularly challenging in Massachusetts, where Proposition 2½ limits the annual growth of property tax revenue. Unlike a corporation that can simply raise prices for its goods or services, municipalities must rely on taxpayers for revenue increases.
Under Prop 2 ½, a community’s levy limit increases by two factors:
1. an incremental increase of 2.5% of the prior year’s levy limit, and
2. a dollar amount derived from the value of new construction and other growth in the local tax base since the previous year, called New Growth.
The 2.5% increase and the new growth number are both added to the prior year’s levy limit to reach the current year’s levy limit. A community can exceed its levy limit with voter approval. Prop 2 ½ gives communities flexibility to support local spending for schools and municipal operations.
A municipality can also decide not to increase its property tax levy by the full 2.5% allowed under Prop 2 ½
After the Great Recession, many towns passed overrides in order to manage the increased demands on their budgets. Hingham was able to balance the budgets with New Growth. While Hingham successfully relied on new growth to balance budgets, that source of revenue has since diminished.
The education budget is a large part of the Town’s budget, similar to every town/city in Massachusetts. Towns are mandated by law to provide education services. Whether it is 120 students among 12 grades or 12 students in 12 grades, the same legal and, thus, financial obligations apply. Massachusetts General Law dictates that the Commissioner of Education sets the educational standards for public schools in Massachusetts. Therefore, a town must comply with the standards set by the Department of Education.
Students with Disabilities: FAPE, “free appropriate public education” is a federal law that guarantees students with disabilities the right to an education that meets their unique needs. It ensures students with disabilities receive an education that is comparable to those without disabilities….it requires schools to provide special ed and related services to meet unique needs of each student.
It is what makes the education budgeting process the most difficult as it is not consistent or predictable. No Child Left Behind (NCLB) is a law that was enacted in 2002 by George W Bush. It built upon existing laws like IDEA by emphasizing accountability, testing, and equal access to education, which requires achieving measurable educational outcomes for all students, including those with disabilities. The NCLB also mandated that all teachers, including special education teachers, meet “highly qualified” standards.
I am grateful for the work of the Sustainable Budget Task Force (SBTF), whose report, issued nearly three years ago, remains relevant today https://www.hingham-ma.gov/DocumentCenter/View/13565/Sustainable-Budget-Task-Force-Final-Report-13122
Page 79 of the report highlights several legal mandates impacting school districts, many of which are unfunded or underfunded by federal and state governments, leaving the financial burden to the towns/cities. Over the past two decades, these mandates have expanded significantly, including the following:
“State law requires a town to educate its children and federal law requires that all children receive a fair and adequate education. There has been a significant increase in state and federal mandates over the past several decades. Although there has been a great deal of discussion about the need to fund items, there has been very little movement at the federal and state levels. Unfunded/underfunded mandates are significantly impacting school districts in the Commonwealth and around the country. Some examples of state and federal mandates that have been added in just the last 20 years include:
· No Child Left Behind
· Internet Safety
· Bullying Prevention Programs
· Texting and Social Media Etiquette
· Elevator and Escalator Safety Instruction
· Body Mass Index Evaluation (Obesity Monitoring)
· Eating Disorder Counseling
· Suicide Awareness Programs
· Organ Donor Awareness Classes
· Steroid Abuse Prevention Programs
· Media Literacy Training
· Expanded Early Childhood Wrap Around Programs
· Financial Literacy Development
· Intruder Lockdown Training
· Health and Wellness Programs
· Leadership Training
· Contextual Learning and Skill Development
· Entrepreneurial/Innovation Skill Development
· Credit Retrieval Programs
· On-Line Learning Requirements
· Race To The Top
· Common Core Standards
· S.T.E.M Programs
· Changes in school discipline
· Concussion Regulations
· Response to Intervention Training
· Preschool Requirements under Early Education and Care Regulations
School Infrastructure
For over a decade, replacing Foster Elementary School has been a pressing need. As you are aware, the Town made the decision to wait for acceptance into the Massachusetts School Building Authority (MSBA) program to secure funding, but we were rejected twice (2017 and 2018) before being accepted on the third attempt. In the interim, the building required costly repairs. The Town voted to set up an Extraordinary Maintenance Capital fund in order to cover the costs of repairs.
In hindsight, the decision to wait for MSBA funding, while fiscally prudent on the surface, may have resulted in higher overall costs to the Town. Delays meant that construction expenses continued to rise due to inflation and escalating materials and labor costs. Moreover, the additional years of repairs placed a financial strain on the Town, which might have been avoided had the decision been made to proceed without MSBA funding.
As was discussed during several meetings recently, we are in need of several roofs, the High School being the most dire. Regular and thorough maintenance is key to avoiding costly emergency repairs and extending the useful life of our facilities. Learning from our history with repairs needed at Foster and the roof collapse at the middle school, I believe it is fiscally prudent to address the roof repairs/replacements, particularly at the high school, so that we are not left in the same predicament as we were during those years. As discussed in our meetings, if we lose the ability to safely use the high school, we do not have another space large enough to accommodate the high school students.
We invite ALL residents to participate in our meetings and ask questions during the budget hearing process.
Town office elections are now underway. I encourage anyone interested to attend least pull papers, have conversations with stakeholders and conduct research into past Warrants and budgets. The following offices are open:
https://www.hingham-ma.gov/CivicAlerts.aspx?AID=2031
There are other ways to get involved in the town if you cannot commit to running for office. While my children were in elementary school, I was able to coach a before school physical activity program. I recently ran the program for the Foster students given the small space they have to contend with for recess. While I am not an educator by trade, I was able to experience some of the issues educators are currently contending with. My interactions were only for 40 minutes a day, but the change in student ability and behavior was apparent.
I also believe it important that we reconvene the Sustainable Budget Task Force to discuss the future sustainability of our town finances.
Best,
Nes Correnti